IntroductionToMLPilot
vip
Age4.3Year
Peak Tier2
Strategy Query: t.me/mlpilot_bot ✈️https://t.me/MLPAImeme
#BTC# #MLP#
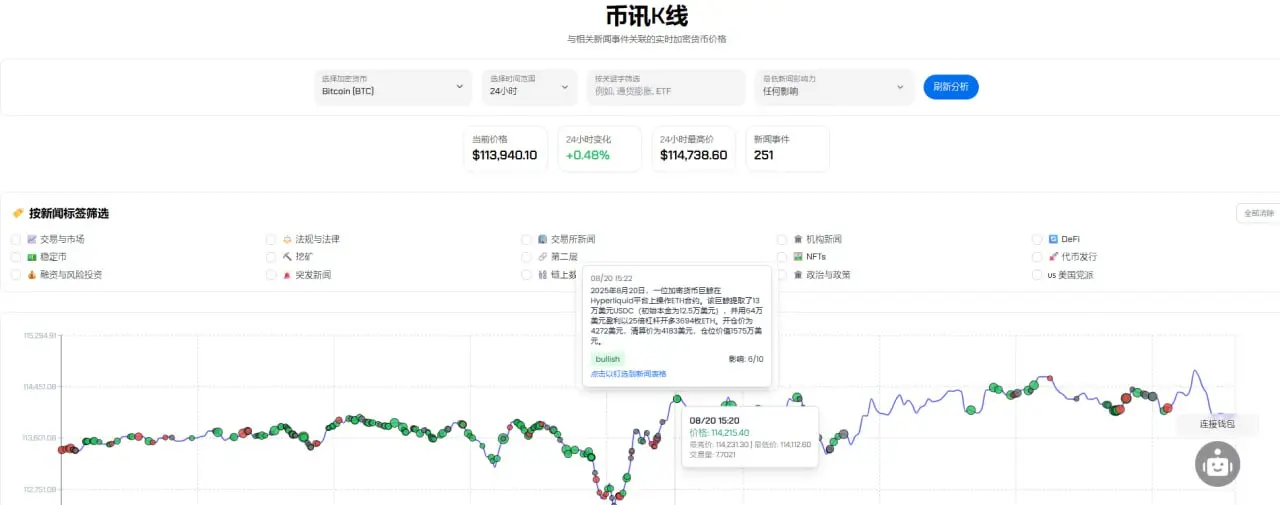
📊 BTC today's market analysis
Current Price: $114,312 💰
24-hour increase: +1.37% 📈
7-day drop: -7.49% 📉
Technical Analysis 🔍
The RSI indicator shows 54.2, which is in the neutral to strong range.
The price is near the middle band of the Bollinger Bands, and volatility is narrowing.
MACD is showing positive values and is continuously rising, indicating a strengthening of short-term momentum.
The Super Trend Indicator shows bearish signals, but the price is approaching a key turning point.
Key price level 🎯
Resistance level: $114,657 (super trend line)
Support level: $113,954 (r
BTC0.55%
MLP-0.63%
View Original
post-image
  • Reward
  • Comment
  • Repost
  • Share
📊 The current price of PUMP is $0.00303. Based on Technical Analysis, the trading strategy is as follows:
short-term strategy 🎯
The current RSI is about 60, in the neutral to strong area.
The 1-hour super trend shows a bullish signal, support level $0.002857
It is recommended to accumulate positions in batches in the range of $0.003020-0.003030.
Set the stop loss below $0.002980
The target level is looking towards the resistance level of $0.003070.
Medium-term view 📈
The daily RSI is only 26, indicating a severely oversold condition.
The daily super trend still shows bearish, a breakthrough
PUMP2.65%
MLP-0.63%
View Original
  • Reward
  • Comment
  • Repost
  • Share
Based on the current OKB Technical Analysis, we provide Futures Trading strategies:
📈 Current Price: $131.04, in a strong upward trend
Bullish Strategy 🚀
Entry Point: Pullback to the $128-129 range (EMA12 support level)
Stop Loss: below $125
Target price: $136-139 (Bollinger Band upper limit and resistance level)
Position: Suggested leverage of 3-5 times
Technical Signal Confirmation ✅
RSI reached 69.12, indicating strong buying pressure.
MACD golden cross continues to expand
Super Trend Indicator is bullish across the board
ADX reached 29.54, trend strength increased.
Risk Warning ⚠️
The sh
OKB52.89%
ADX4.09%
MLP-0.63%
View Original
  • Reward
  • Comment
  • Repost
  • Share
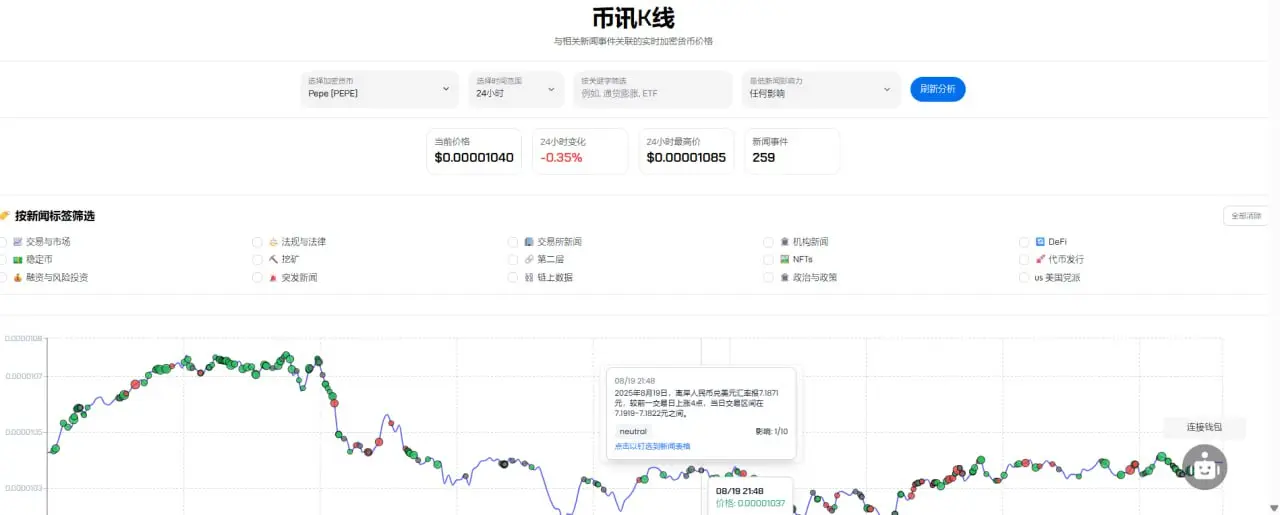
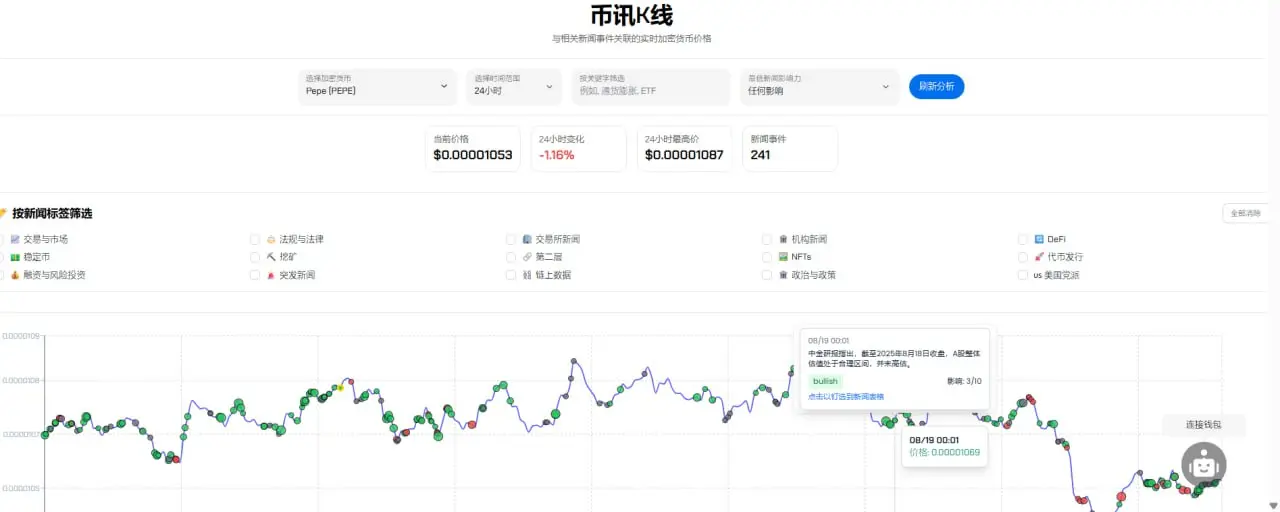
📊 PEPE current price: $0.00001040
Technical Analysis 🔍
RSI(14): 42.29, in a neutral to weak area
The price is below all EMA lines, indicating a bearish trend.
The SuperTrend indicator shows a continuous sell signal.
The MACD histogram has turned positive, indicating an improvement in short-term momentum.
Key Price Level 🎯
Resistance level: $0.0000107 (EMA12)
Support level: $0.00001013 (recent low)
Operation Strategy ⚡
Short term: Wait for a rebound to short in the $0.0000107-$0.0000108 range, with a stop loss at $0.0000111 and a target of $0.00001020.
Middle line: After breaking below the s
PEPE2.25%
MLP-0.63%
View Original
post-image
  • Reward
  • Comment
  • Repost
  • Share
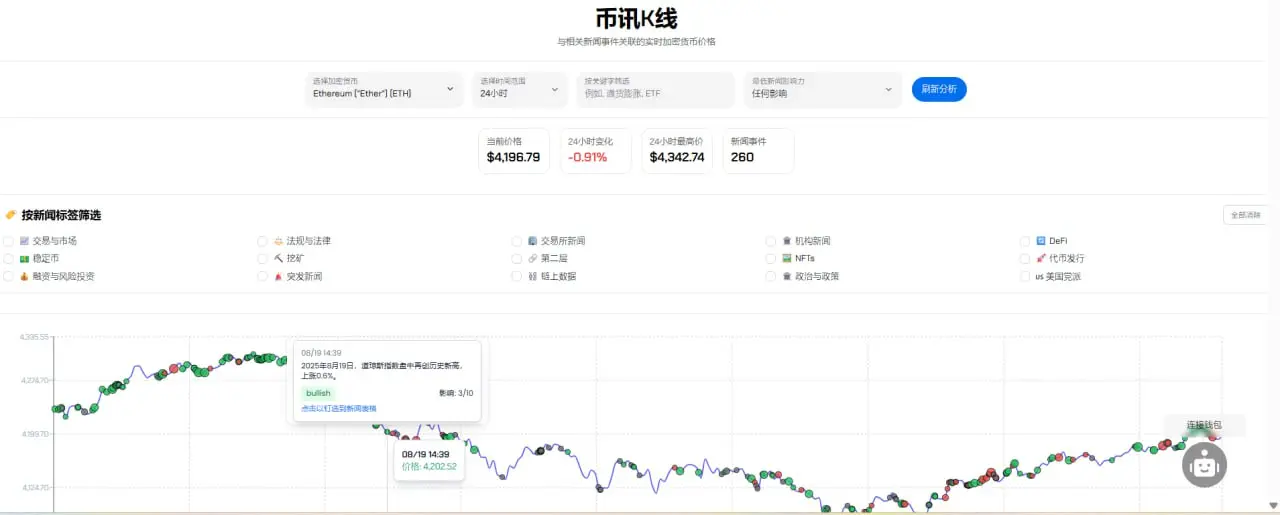
Based on the current ETH price of $4191.99, here is a Technical Analysis for your Futures Trading strategy:
📊 Current Market Conditions
ETH is at a critical technical position, the 1-hour super trend indicator continues to show bearish signals, and the price is running below the resistance level of $4251.
🎯 Short Selling Strategy
Entry Point: $4210-4220 rebound area
Stop Loss: $4260 (above the super trend resistance level)
Target 1: $4150 (Daily Pivot Support)
Target 2: $4098 (Daily S1 Support)
📈 Technical Basis
The RSI has bounced from the oversold area to around 50, indicating potential p
ETH3.66%
MLP-0.63%
View Original
post-image
  • Reward
  • Comment
  • Repost
  • Share
📊 Current market analysis of GT Token
💰 Current Price: $17.07, 24-hour drop 2.05%, 7-day decline 12.08%
📈 Market Cap: $2.099 billion, 24h Trading Volume $7.88 million
🔍 Technical Analysis:
The 1-hour chart shows the price operating below the $17.18 super trend line, continuing the bearish signal.
The daily chart super trend provides long-term support near $16.18.
The RSI indicator shows 51.87, which is in the neutral to weak zone.
The middle band of the Bollinger Bands is at $16.95, and the price is running on the upper band.
📉 Key resistance level: $17.30-$17.45 range
🛡️ Support level:
GT6.64%
MLP-0.63%
View Original
  • Reward
  • 1
  • Repost
  • Share
PurpleQiComesFromTheEastvip:
nonsense
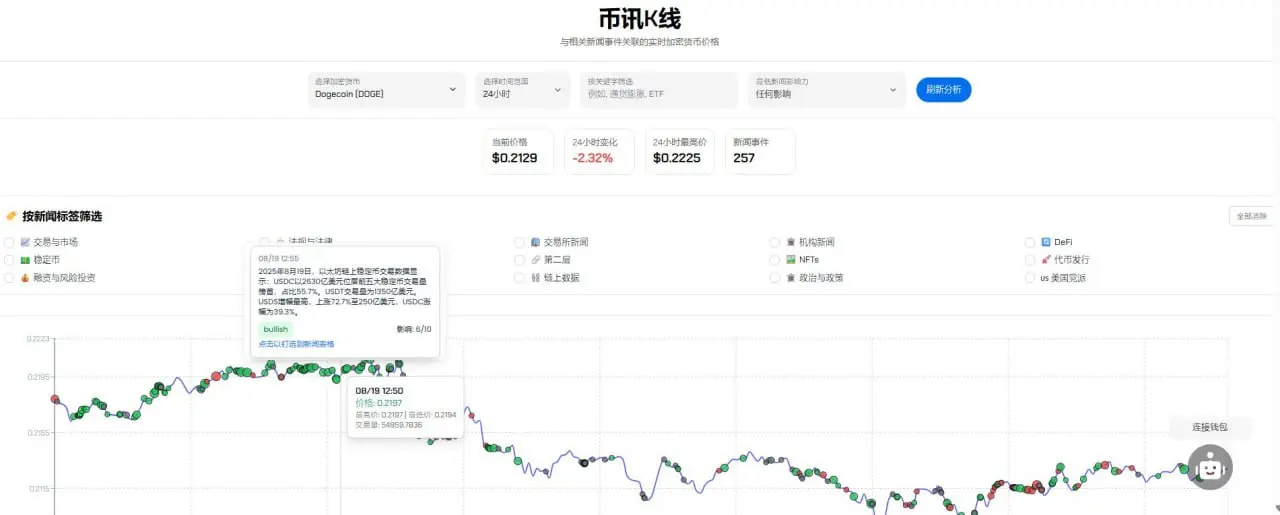
📊 Current price of DOGE: $0.213, 24-hour fall 2.30%, 7-day fall 9.49%
🔴 Technical Analysis
RSI(14): 41.27, in the weak zone
The price has fallen below all EMA lines, indicating a clear bearish trend.
SuperTrend indicator continues to show bearish signals
The MACD histogram has turned positive but the strength is weak.
📈 Key price level
Resistance level: $0.2189 (SuperTrend line)
Support level: $0.2082 (Bollinger Band lower edge)
💡 Operation Strategy
Short-term: It is recommended to watch and wait for a fall below $0.208 before considering a rebound to go long.
Midline: The bearish trend re
DOGE3.85%
MLP-0.63%
View Original
post-image
  • Reward
  • Comment
  • Repost
  • Share
Based on the current SOL Technical Analysis, we provide Futures Trading strategies:
📊 Current Price Analysis
The current price of SOL is $181.03, up 1.57% in the last 24 hours, but down 9.35% over the last 7 days.
🔴 Technical signals are bearish
The 1-hour Super Trend shows a continuous short signal.
Price is below all EMA moving averages (12/20/55)
RSI is at 53.36, slightly neutral.
The MACD histogram turns positive but the signal line remains negative.
📈 Futures Trading Strategy Recommendations
Long Strategy: Enter after breaking $183.95 (Super Trend Resistance)
Target price: $187-$190
St
SOL2.54%
MLP-0.63%
View Original
  • Reward
  • Comment
  • Repost
  • Share
📊 PI coin trading strategy analysis
Current price: $0.3567 💰
Technical signals 📈:
RSI(14): 42.23 - Approaching oversold area
MACD: shows a slight bullish divergence
Super Trend: The 1-hour chart shows bearish, while the daily chart shows bullish.
Bollinger Bands: Price is close to the lower band support
Key price level 🎯:
Support level: $0.3517 ( has fallen below the previous support ).
Resistance levels: $0.3673, $0.3699
Daily support: $0.3410
trading strategy ⚡:
Short-term trading strategy:
Wait for $0.3517 to stabilize before taking a small long position, with a stop loss at $0.3476 an
PI5.22%
View Original
  • Reward
  • 1
  • Repost
  • Share
GateUser-8dfa0cecvip:
Since Pi was listed on the exchange in March, due to excessive confidence in Pi and being misled by a large amount of false favourable information, I have unfortunately missed 4 to 5 waves of the bull run. Moreover, I have lost quite a bit of money holding Pi. Looking at it now, this coin seems to be specifically designed to deceive Chinese believers, and it is truly a great evil!
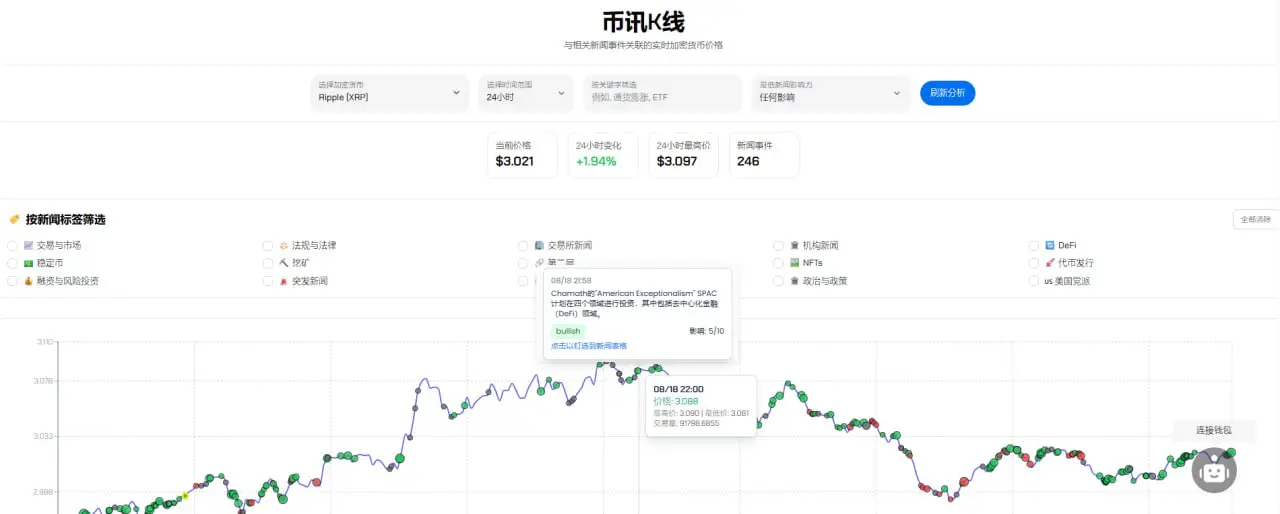
📊 XRP Contract Strategy Analysis
Current Price: $3.0198 💰
Technical signals:
The 1-hour super trend shows bullish signals, with support at $2.9857 📈
The daily super trend has turned bearish, with resistance at $3.4588 📉
The RSI is at 46.34 in the neutral zone, and the MACD shows weakness ⚖️
Contract Strategy Recommendations:
Long Strategy 🟢:
Entry: $2.98-3.00 range
Stop Loss: $2.97
Target: $3.05-3.08
Leverage: 3-5 times
Short Selling Strategy 🔴:
Entry: rebound in the $3.08-3.10 range
Stop loss: $3.12
Target: $2.95-2.90
Leverage: 3-5 times
Risk Warning ⚠️:
The daily trend is bearish, with
XRP0.86%
View Original
post-image
  • Reward
  • Comment
  • Repost
  • Share
Based on the current LINK Technical Analysis, we provide you with Futures Trading strategies:
📊 Current Price: $24.27, at a key technical position
🔴 Short Selling Strategy (Recommended):
Entry point: $24.30-24.50 range
Stop Loss: $25.20
Target Price: $23.50 → $22.70
Leverage: 3-5 times
Reason: The hourly SuperTrend indicates a bearish trend across the board, the RSI shows an overbought pullback, and the EMA12 has crossed below the EMA20, forming a death cross.
📈 Long Strategy (Cautious):
Entry Point: Rebound confirmation after breaking below $23.80
Stop Loss: $23.20
Target price: $25.60
Lev
MLP-0.63%
View Original
  • Reward
  • Comment
  • Repost
  • Share
📈 The current price of AIOT is $1.44, with a 7-day rise of 183.23% and a 24-hour rise of 47.98%, showing a strong pump trend!
🎯 Operating Strategy:
Short-term trading 💰
A pullback to the $1.30-1.35 range can be considered for gradual accumulation.
Set the stop loss below $1.20
Target price looks towards $1.60-1.80
Risk Reminder ⚠️
1 hour drop -2.26% shows short-term pullback pressure
The trading volume of $194 million indicates a high level of market activity.
It is recommended to control your position and avoid chasing highs.
Key Observations 🔍
Can it hold the $1.40 support level?
Breakin
MLP-0.63%
View Original
  • Reward
  • Comment
  • Repost
  • Share
Based on the current PEPE Technical Analysis, provide Futures Trading strategies:
📊 Current Price: $0.00001053
🔴 Short selling strategy is better
The Super Trend Indicator shows a "short" signal on both the 1-hour and daily charts.
Price is below all EMA moving averages (12, 20, 55)
The RSI is in the weak range of 42.75.
MACD Histogram Turns Negative
📈 Specific operational suggestions:
Short Entry: 0.00001060-0.00001070 range
Stop Loss: 0.00001090 (Resistance Level Above)
Target Price:
First target: 0.00001030
Second target: 0.00001000
⚠️ Risk Management:
It is recommended to control the p
PEPE2.25%
MLP-0.63%
View Original
post-image
  • Reward
  • Comment
  • Repost
  • Share
  • Topic
  • Pin
Trade Crypto Anywhere Anytime
qrCode
Scan to download Gate App
Community
English
  • 简体中文
  • English
  • Tiếng Việt
  • 繁體中文
  • Español
  • Русский
  • Français (Afrique)
  • Português (Portugal)
  • Bahasa Indonesia
  • 日本語
  • بالعربية
  • Українська
  • Português (Brasil)