

- Topic
16k Popularity
102k Popularity
129k Popularity
6k Popularity
3k Popularity
- Pin
- 🎉 Hey Gate Square friends! Non-stop perks and endless excitement—our hottest posting reward events are ongoing now! The more you post, the more you win. Don’t miss your exclusive goodies! 🚀
🆘 #Gate 2025 Semi-Year Community Gala# | Square Content Creator TOP 10
Only 1 day left! Your favorite creator is one vote away from TOP 10. Interact on Square to earn Votes—boost them and enter the prize draw. Prizes: iPhone 16 Pro Max, Golden Bull sculpture, Futures Vouchers!
Details 👉 https://www.gate.com/activities/community-vote
1️⃣ #Show My Alpha Points# | Share your Alpha points & gains
Post your - 🚀 ETH jumped to $4,600 this morning, up 8.69% in 24h!
Just shy of the $4,891 ATH—think it breaks through?
📍 Follow Gate_Square, vote and drop your reason.
🎁 4 winners split $100 Futures Voucher! - 📢 Exclusive on Gate Square — #PROVE Creative Contest# is Now Live!
CandyDrop × Succinct (PROVE) — Trade to share 200,000 PROVE 👉 https://www.gate.com/announcements/article/46469
Futures Lucky Draw Challenge: Guaranteed 1 PROVE Airdrop per User 👉 https://www.gate.com/announcements/article/46491
🎁 Endless creativity · Rewards keep coming — Post to share 300 PROVE!
📅 Event PeriodAugust 12, 2025, 04:00 – August 17, 2025, 16:00 UTC
📌 How to Participate
1.Publish original content on Gate Square related to PROVE or the above activities (minimum 100 words; any format: analysis, tutorial, creativ - 💙 Gate Square #Gate Blue Challenge# 💙
Show your limitless creativity with Gate Blue!
📅 Event Period
August 11 – 20, 2025
🎯 How to Participate
1. Post your original creation (image / video / hand-drawn art / digital work, etc.) on Gate Square, incorporating Gate’s brand blue or the Gate logo.
2. Include the hashtag #Gate Blue Challenge# in your post title or content.
3. Add a short blessing or message for Gate in your content (e.g., “Wishing Gate Exchange continued success — may the blue shine forever!”).
4. Submissions must be original and comply with community guidelines. Plagiarism or re - 🎉 The #CandyDrop Futures Challenge# is live — join now to share a 6 BTC prize pool!
📢 Post your futures trading experience on Gate Square with the event hashtag — $25 × 20 rewards are waiting!
🎁 $500 in futures trial vouchers up for grabs — 20 standout posts will win!
📅 Event Period: August 1, 2025, 15:00 – August 15, 2025, 19:00 (UTC+8)
👉 Event Link: https://www.gate.com/candy-drop/detail/BTC-98
Dare to trade. Dare to win.
2100NEWS WEEKLY CRYPTO REPORT Aug-8
The crypto index NWST1100 recovered by 5.79% last week. Ether has outperformed other segments, surging by 44.97% in the previous thirty days.
*Below, we present a standardized weekly report and next week’s outlook, prepared based on the Theory Swingtum of intelligent finance. We gauge the crypto market’s breadth and direction by showing charts 2100NEWS Digital Assets Total Index (NWST1100), which measures 1100 (by market capitalization) significant crypto assets’ performance. The information-laden chart is complex to read initially, but it effectively displays essential price information, crucial decisive price levels, momentum, trading volumes, and crypto market breadth. Monitoring Market Sentiment and Breadth is necessary to detect early signs of trend reversals or continued strength.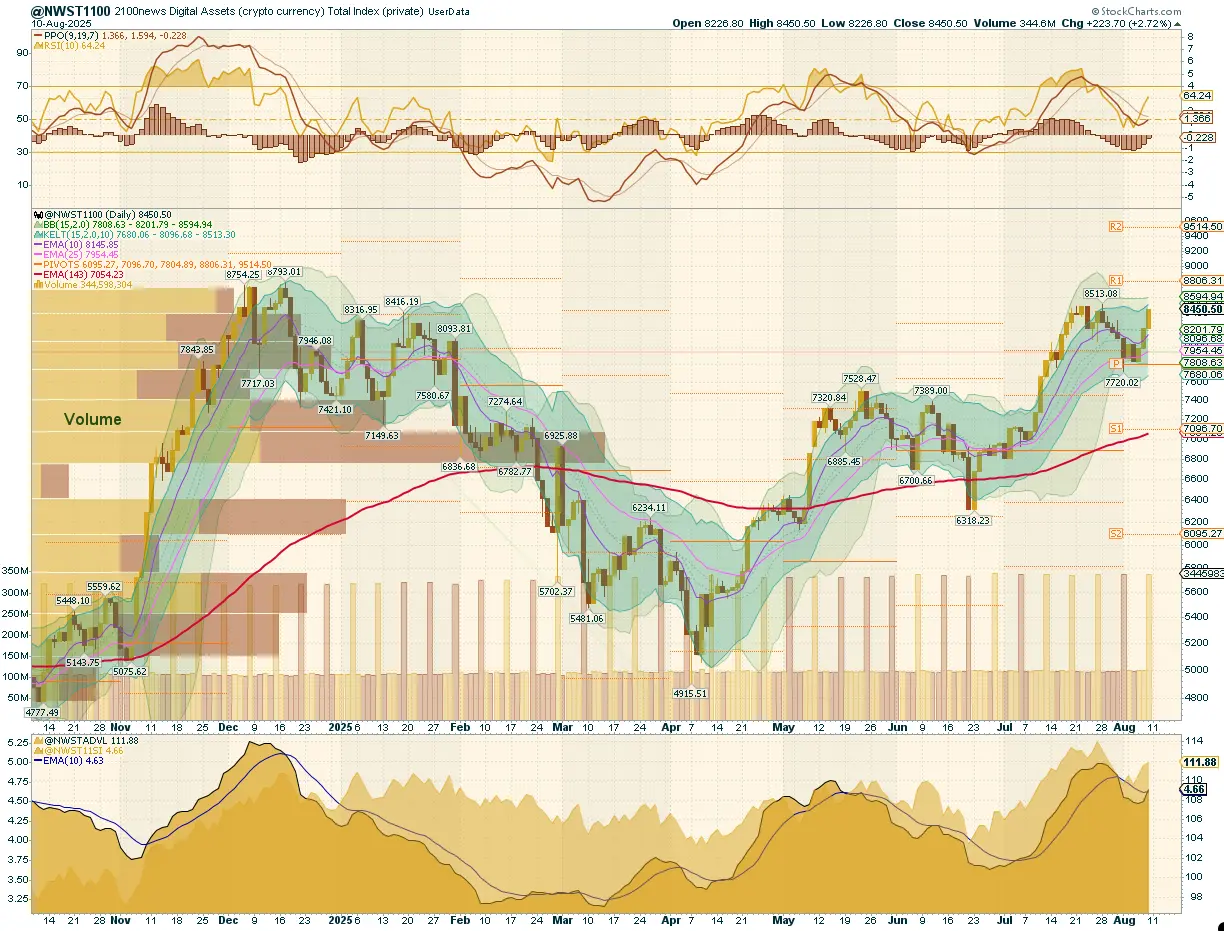
After conducting a detailed examination of the NWST1100 chart, a vital metric for the cryptocurrency market, several essential market dynamics and changes in market sentiment are revealed:
The NWST1100: As outlined in last week’s outlook, the index followed the projected scenario of sideways consolidation between the 10-day and 25-day EMAs, with Pivot P (~7,800) acting as a firm technical floor. This week, the NWST1100 gained +5.79%, closing at 8,450 points and holding above both short-term averages. After a decisive rebound from the ~7,700 support area early in the week, prices consolidated briefly before pushing higher midweek. On Friday, the index broke above its recent short-term high but remained contained under the upper Keltner Channel boundary (~8,500).
Market Sentiment (PPO & RSI): The PPO lines moved closer to the zero line from above, while the histogram — still negative — turned upward, reflecting a clear deceleration in downside momentum. This suggests that selling pressure has eased, but has not yet transitioned into a confirmed bullish expansion phase. Meanwhile, the RSI reversed course midweek, rising steadily to finish at 64, confirming improved short-term momentum while staying below overbought territory.
Crypto Market Breadth indicators at the bottom of the chart, the Advance-Decline Volume Line (ADVPL) and the McClellan Summation Index turned upward midweek, signaling that strong buying emerged at support. This influx was evident both in the number of advancing digital assets within the index and in the capital committed to them. The move marks the likely end of the first corrective wave within the consolidation phase that followed July’s cycle high, with breadth now aligning with price in the rebound toward the upper boundary of the consolidation channel.
In summary, the crypto market has staged a rebound within its consolidation phase. The ongoing structural rotation into altcoins remains intact, though the approach of significant resistance levels warrants caution. Failure to break convincingly above ~8,500 could trigger renewed profit-taking or a return toward support.
According to the chart on the right, A50R indicators across all four market segments (NWST1100, NWSET100, NWSL100, NWSCo100)have sharply recovered:
However, this strong participation in large and Ethereum-based segments contrasts with the relative underperformance of mid-, small-, and micro-cap assets. The pattern confirms that capital is selectively rotating into established, fundamentally stronger projects rather than driving a uniform “risk-on” rebound.
This breadth indicator measures the percentage of digital assets trading above a 50-day moving average
* The percentage of digital assets trading above a specific moving average is a breadth indicator that measures internal strength or weakness in the underlying index. The chart on the right side compares the percentage of DA trading above the 50-day EMA for:
Outlook for this week
This report examines the cryptocurrency market’s short-term outlook, identifying patterns and signals that may offer insights into potential market direction. While predicting market behavior is inherently uncertain, discernible trends in momentum and market breadth indicators suggest possible developments.
In conclusion, following a sharp rebound, the market has now entered a resistance zone. The most probable scenario in the coming days is an attempt to retest resistance between 8,500 and 8,800 (Point & Figure target and Pivot R1). If the first breakout attempt in the early part of the week fails — as historical patterns suggest is likely — a short-term retracement toward the 8,000 area is expected. This zone, near the 25-day EMA, should provide a temporary technical floor. Instead of expecting a strong directional continuation, traders should prepare for whipsaw price action, elevated volatility, and fading momentum during tests of both resistance and support extremes.
📍 Key levels to watch:
Resistance: 8600 (Point & Figure chart, bullish price objective), 8,800 (Pivot R1)
Support: 8,000 (EMA25)
Performance of different groups of Digital Assets (Coins and Tokens)
Investors and traders often rely on historical performance data to make informed decisions about their cryptocurrency holdings. After analyzing the data in the table, it is evident that the crypto market has rebounded, with the overall index recovering by 5.79% over the last week.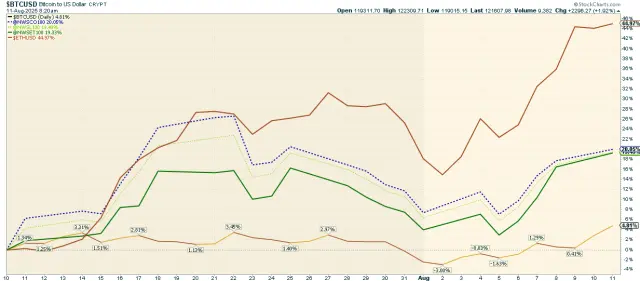 The chart above highlights the performance of various cryptocurrencies, including Bitcoin, Ether, and the 2100NEWS Indices, which represent the performance of Ethereum-based tokens (NWSET100), large caps (NWSL100), and Coins (NWSCo100). Among these, Ether stood out, significantly outperforming other segments with a remarkable 44.97% gain over the past thirty days.
While the broader market has rebounded, different segments and individual cryptocurrencies exhibit different performance dynamics.
Performance Trends by Market Segment:
✔ Ether, NWSET100 (Ethereum-based tokens), NWSCo100 (Coins), and NWSL100 (Large Caps) weakened the market**,**
✔ NWSBE, Bitcoin, and NWS30 improved.
Investors and traders might use this information to adjust their portfolios, possibly shifting focus toward assets with stronger relative momentum while being cautious about those in the Weakening quadrant.
*RRG® charts show the relative strength and momentum of groups of digital assets. Those with strong relative strength and momentum appear in the green Leading quadrant. As relative momentum fades, they typically move into the yellow Weakening quadrant. If relative strength then fades, they move into the red Lagging quadrant. Finally, when momentum picks up again, they shift into the blue Improving quadrant.
Crypto (Digital Assets) compared with global equity
This report offers a comprehensive analysis comparing the performance of digital assets, as signified by the NWST1100 index, to shares on global capital markets, as represented by the Dow Jones Global W1Dow index. The comparison spans various timeframes, providing insights into both historical and recent performances, as well as potential future trends.
Let’s break down the key observations and implications:
The recent rally highlights the importance of tracking market swings. Historically, the best opportunities have emerged when sentiment was weakest and prices were below the 143-day EMA. Conversely, when the market rallies strongly and extends far above the 143-day EMA, as it is now, it is often prudent to start building cash reserves to take advantage of future pullbacks.
*The box in the middle of the chart shows the original NWST1100 price; at the bottom is W1Dow